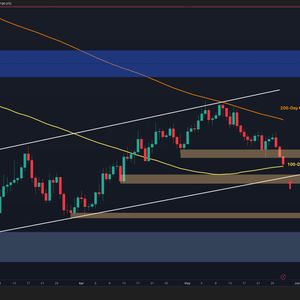
Solana is testing a major support area on both the monthly and four-hour charts. Analysts say a break below $81.20 could push SOL toward the $71.92–$77.96 support zone , while a hold would keep the broader channel structure alive. Solana Price Tests Lower Channel Support on Monthly Chart Solana is trading near the lower boundary of a monthly descending channel, according to a chart shared by Bitcoinsensus on X. The analyst said SOL is testing lower channel support, keeping this area important for the higher-timeframe structure. Solana Monthly Chart. Source: Bitcoinsensus on X The chart shows SOL moving lower inside a blue descending channel after failing to hold its 2025 recovery area. Price has now reached the lower channel line, where buyers need to defend the structure. This support zone matters because it sits near the lower end of the current monthly range. If SOL holds this area, the chart could leave room for another move toward the middle or upper part of the channel. The chart also shows a large rounded base from 2022 to 2024 before SOL moved back toward the previous high area. That earlier structure helped price recover, but the latest pullback has pushed SOL back into a weaker position. The upper channel line now acts as the main resistance. A move back toward that level would show stronger recovery pressure, but SOL first needs to hold the lower boundary. If Solana breaks below the lower channel support, the monthly setup would weaken. That could open the way for a deeper move toward lower support levels below the current range. For now, the chart shows SOL at a major higher-timeframe test. The next signal depends on whether buyers defend the lower channel or sellers force a breakdown. Solana Price Weakens as $81.20 Level Puts SOL Support Zone in Focus Solana is showing weakness on the four-hour chart as analyst MCO Global says another low may be likely if SOL loses the $81.20 level. The chart shared on X shows SOL trading close to short-term support after failing to continue higher from its recent range. The analyst said a break below $81.20 would bring the next support zone between $71.92 and $77.96 into focus. Solana Support Chart. Source: MCO Global on X The chart shows SOL moving lower after a rejected recovery attempt near the upper part of the recent structure. Price has now returned to the lower short-term range, where the $81.20 area acts as the key confirmation level. MCO Global said Solana still looks weak, but the setup needs confirmation. That means the bearish case depends on whether SOL breaks below the current support instead of holding the range. The main support zone sits between $71.92, $75.41, and $77.96. These levels appear inside the orange range marked as the main support area on the chart. If SOL breaks below $81.20, sellers could push price toward that support band. A move into the zone would test whether buyers still defend the broader range. However, if SOL holds above $81.20, the breakdown setup would remain unconfirmed. In that case, price could continue moving sideways before choosing a clearer direction.